Explore Sequence Diversity
This page contains the contents for a jupyter notebook used to demonstrate using cazomevolve to explore
the sequence diversity in the CAZy family PL20.
The original notebook can be found here and which can be used as a template.
Notebook
This notebook is for exploring protein sequence diversity in a set of CAZymes, e.g. a CAZy family.
Prior to using this notebook:
Build a local CAZyme db using
cazy_webscraperRetrieve the protein sequences for each CAZy family of interest using the
cazomevolesubcommandget_fam_seqsRun all-vs-all analysis using BLAST or DIAMOND using the
cazomevolvesubcommandsrun_fam_blastandrun_fam_diamond, respectively
This notebook takes as input the output from BLASTP+/DIAMOND and visualises the data.
Feel free to use this notebook as a template to perform further analyses.
Imports
import seaborn as sns

from cazomevolve.seq_diversity.explore.cazy import get_cazy_proteins, get_cazy_db_prots
from cazomevolve.seq_diversity.explore.parse import load_data, remove_redunant_prots
from cazomevolve.seq_diversity.explore.plot import plot_clustermap, plot_heatmap_of_clustermap
Constants
Define proteins of interest, e.g. proteins to be explored in the lab. These will be highlighed on the resulting clustermaps and heatmaps.
The dict uses the group name (e.g. a CAZy family) as the key, and is
valued by a list of the NCBI protein version accessions.
CANDIDATES = {
    'PL20': ['EAA65331.1', 'UKZ86141.1', 'WAO96149.1']
}
Get ‘characterised’ proteins from CAZy
To retrieve proteins listed in the ‘characterised’ or ‘structure’ tables
in CAZy, using the get_cazy_db_prots function.
We store proteins listed in the characterised table in the variable
characterised_prots, and proteins in the structure table are listed
in structure_prots.
characterised_prots = {}  # {fam: [prot acc]}
characterised_prots['PL20'] = get_cazy_db_prots('PL20', characterised=True)
characterised_prots
Parsing characterised table for PL20: 100%|██████████| 7/7 [00:00<00:00, 5420.00it/s]
{'PL20': ['BAG80639.1', 'OSZ99920.1', 'OTA07247.1']}
structured_prots = {}  # {fam: [prot acc]}
structured_prots['PL20'] = get_cazy_db_prots('PL20', structured=True)
structured_prots
Parsing structured table for PL20: 100%|██████████| 7/7 [00:00<00:00, 9031.11it/s]
{'PL20': ['BAG80639.1']}
Family analysis
Here is some example code for running the analysis for CAZy family PL20.
# load data
pl20_df = load_data('../../docs/examples/pl20/pl20_blastp', 'PL20')
pl20_df.head(5)
Identifying IPGs: 0%| | 0/110 [00:00<?, ?it/s]
Identified 8 groups of identical proteins
| qseqid | sseqid | qlen | slen | length | pident | evalue | bitscore | BSR | qcov | scov | |
|---|---|---|---|---|---|---|---|---|---|---|---|
| 0 | EAQ84327.1 | EAQ84327.1 | 250 | 250 | 250 | 100.000 | 0.000000e+00 | 520.0 | 2.080 | 1.000 | 1.000000 |
| 1 | EAQ84327.1 | AEO59473.1 | 250 | 250 | 250 | 79.600 | 6.520000e-157 | 428.0 | 1.712 | 1.000 | 1.000000 |
| 2 | EAQ84327.1 | EDP51830.1 | 250 | 292 | 254 | 57.874 | 4.100000e-109 | 309.0 | 1.236 | 1.016 | 0.869863 |
| 3 | EAQ84327.1 | QSQ14196.1 | 250 | 255 | 251 | 53.785 | 3.570000e-101 | 287.0 | 1.148 | 1.004 | 0.984314 |
| 4 | EAQ84327.1 | QSQ27087.1 | 250 | 255 | 247 | 54.251 | 3.500000e-100 | 285.0 | 1.140 | 0.988 | 0.968627 |
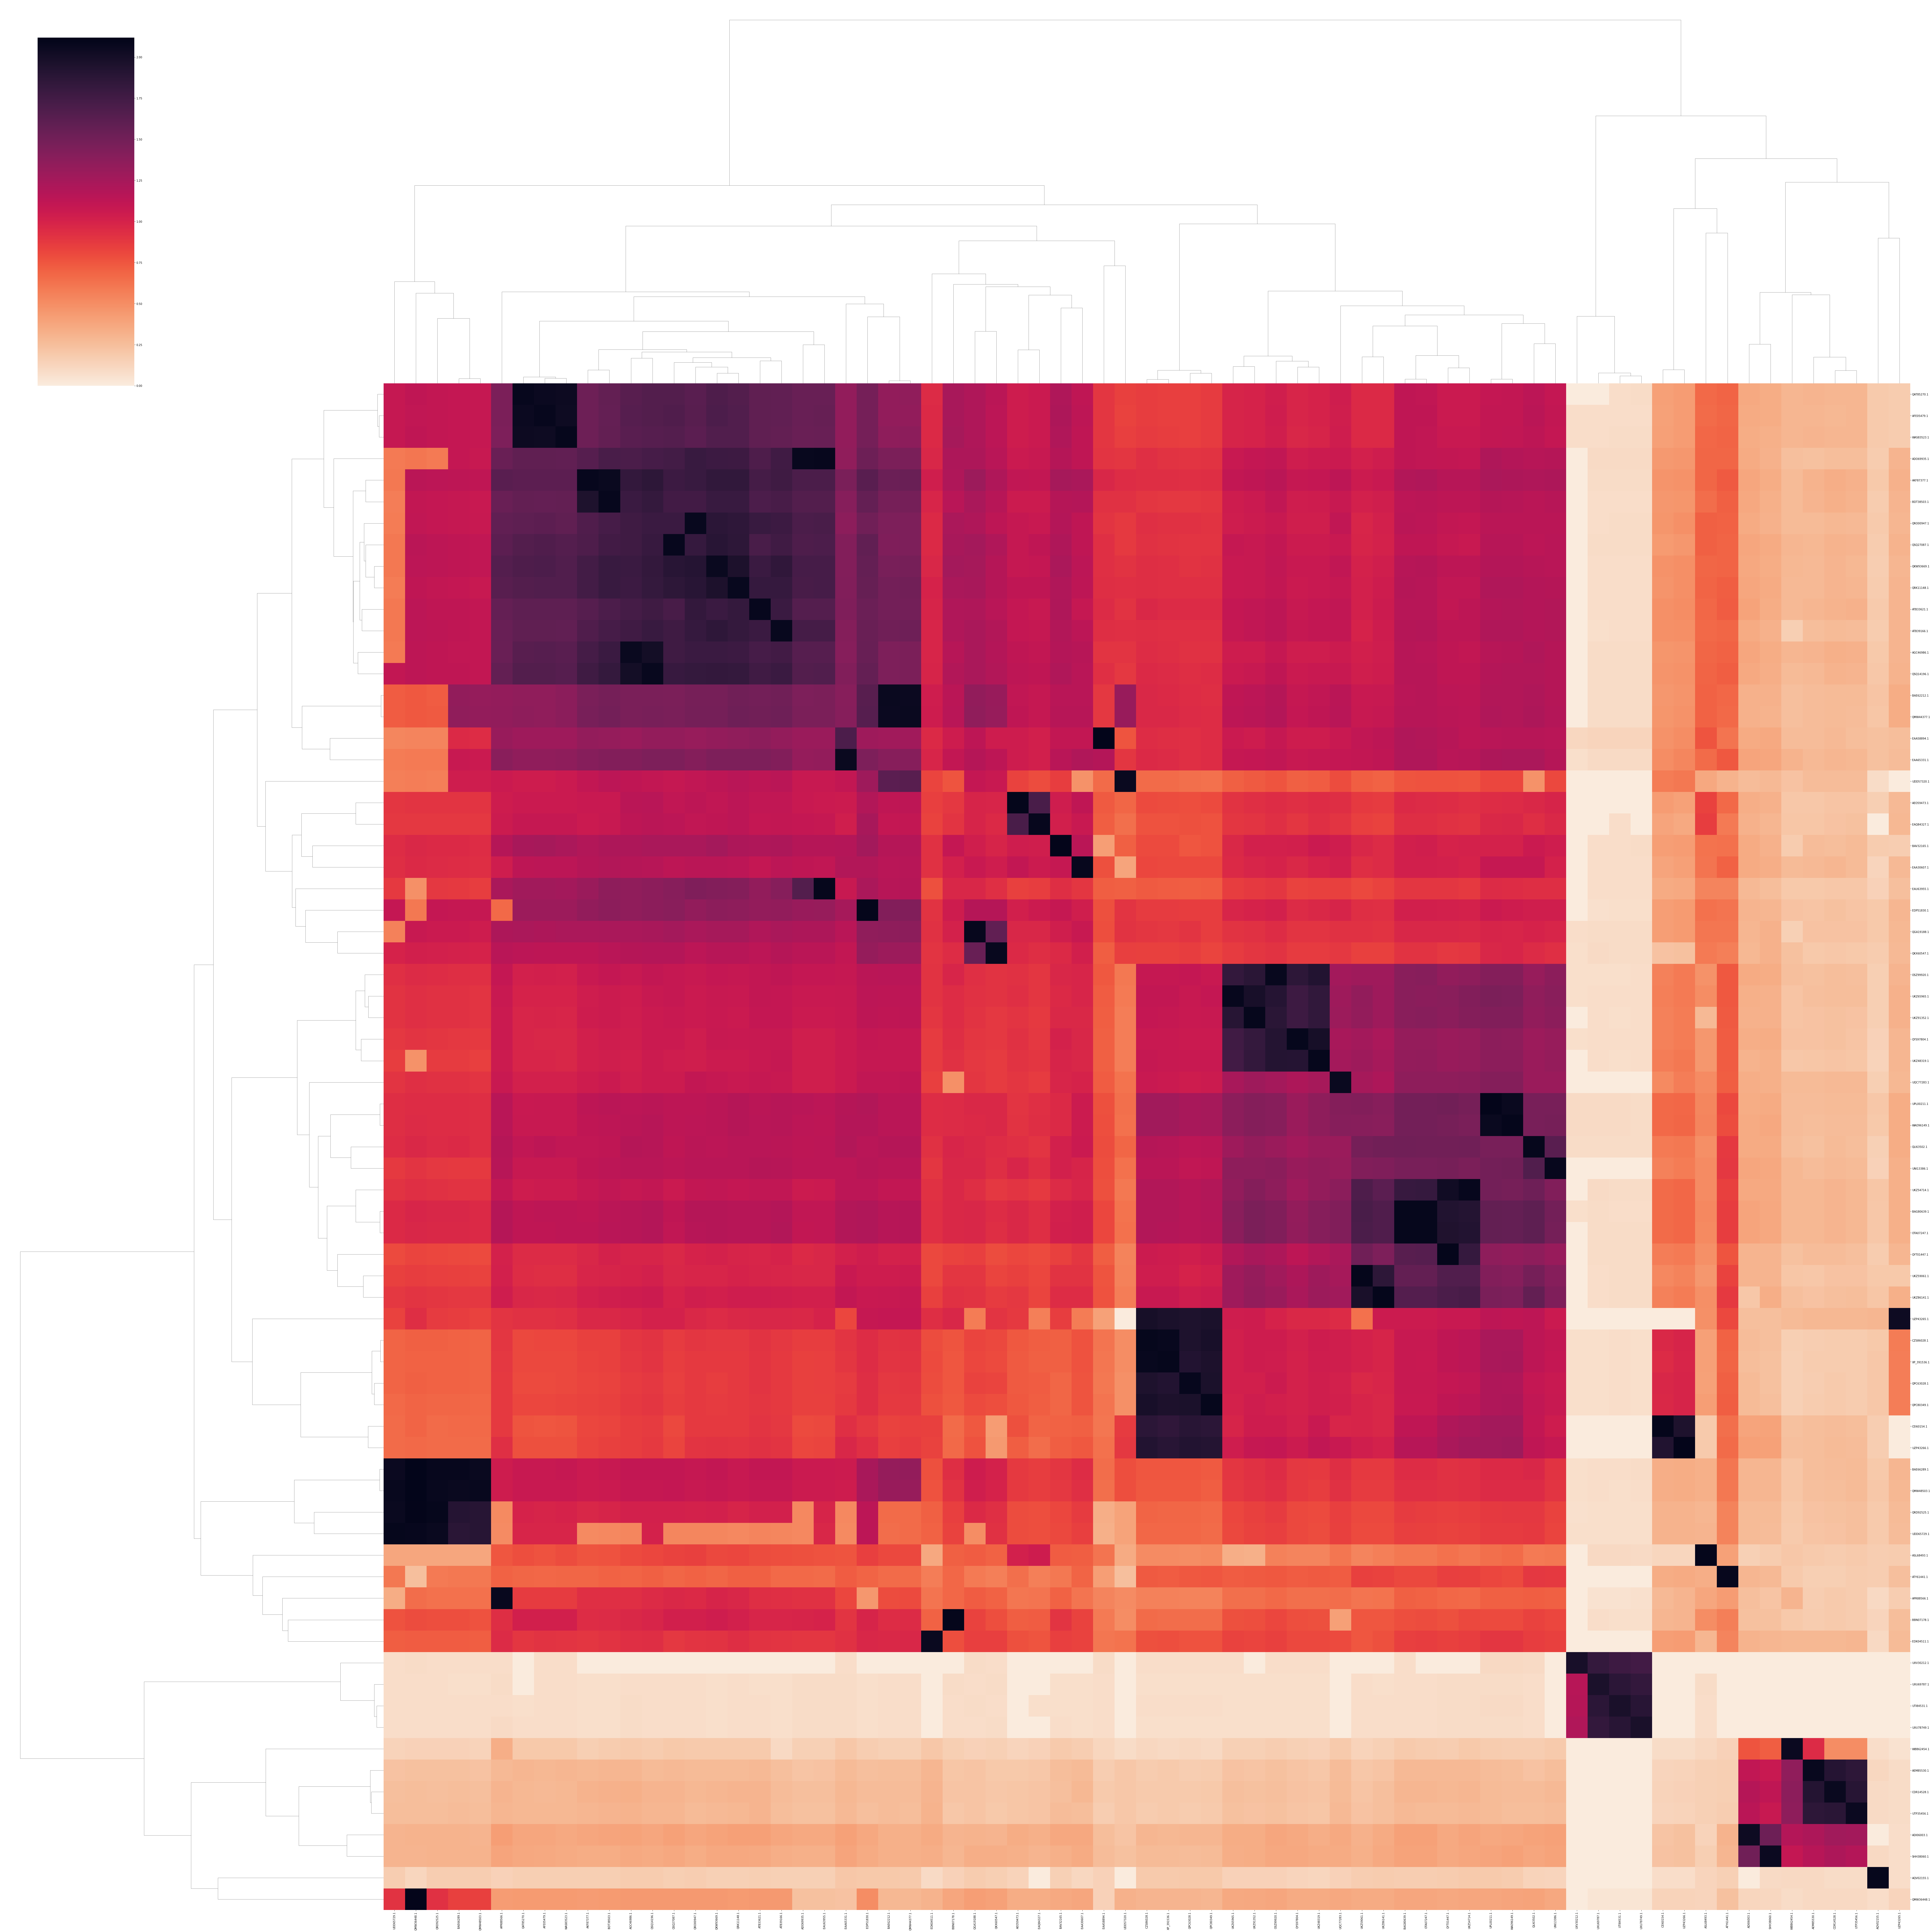
# build clustermap of BLAST Score Ratio
pl20_bsr_plt = plot_clustermap(pl20_df, 'PL20', 'BSR', fig_size=(100, 100), save_fig='pl20_clustermap.png')
pl20_bsr_plt
<seaborn.matrix.ClusterGrid at 0x7fbb8c265460>
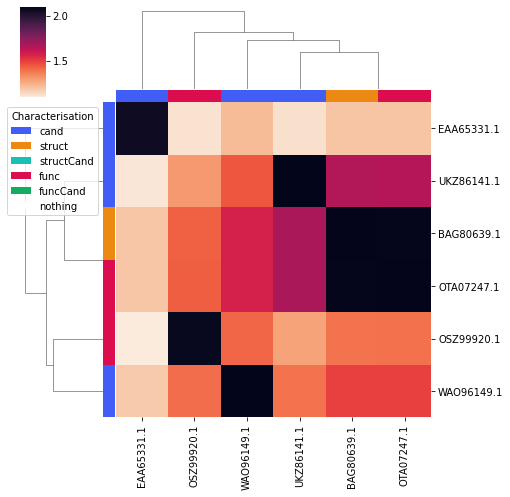
# plot a clustermap of only the candidates and functionally/structurally characterised proteins
# that is also annotated to differentiate, candidates and functionally/structurally characterised proteins
pl20_char_bsr_plt = plot_clustermap(
    pl20_df,
    'PL20',
    'BSR',
    fig_size=(7, 7),
    char_only=True,
    annotate=True,
    candidates=CANDIDATES, structured_prots=structured_prots, characterised_prots=characterised_prots,
)
pl20_char_bsr_plt
<seaborn.matrix.ClusterGrid at 0x7fbb7b99f520>
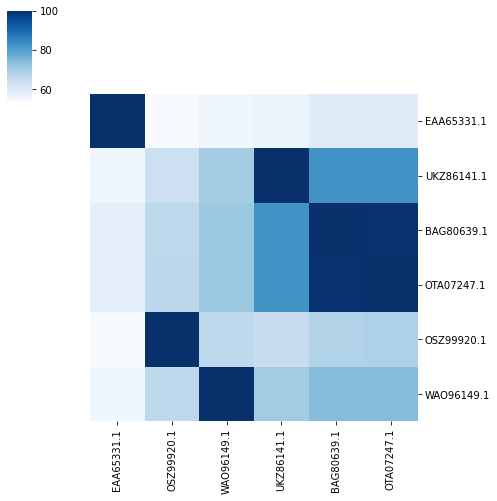
Then plot the precentage identity and query coverage for the candidate and functionally/structurally characterised proteins, plotting the proteins on the heatmaps in the same order as they appear in the clustermap.
print('PL20 percentage identity, colour scheme blue')
plot_heatmap_of_clustermap(
    pl20_char_bsr_plt,
    pl20_df,
    'PL20',
    'pident',
    fig_size=(7, 7),
    colour_scheme=sns.color_palette("Blues", as_cmap=True),
    candidates=CANDIDATES, structured_prots=structured_prots, characterised_prots=characterised_prots,
)
PL20 percentage identity, colour scheme blue
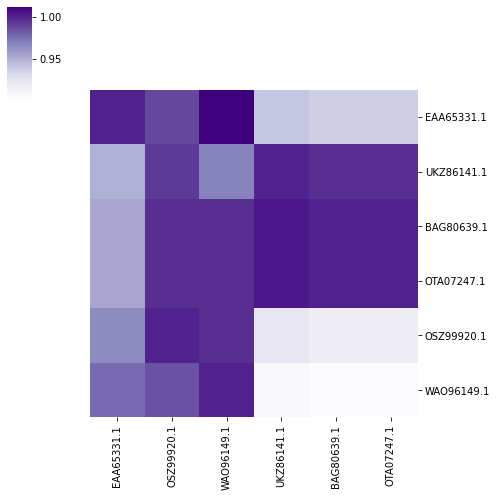
print('PL20 query coverage, colour scheme purple')
plot_heatmap_of_clustermap(
    pl20_char_bsr_plt,
    pl20_df,
    'PL20',
    'qcov',
    fig_size=(7, 7),
    colour_scheme=sns.color_palette("Purples", as_cmap=True),
    candidates=CANDIDATES, structured_prots=structured_prots, characterised_prots=characterised_prots,
)
PL20 query coverage, colour scheme purple